Case study: Experience metrics
Overview
Problem
Solution
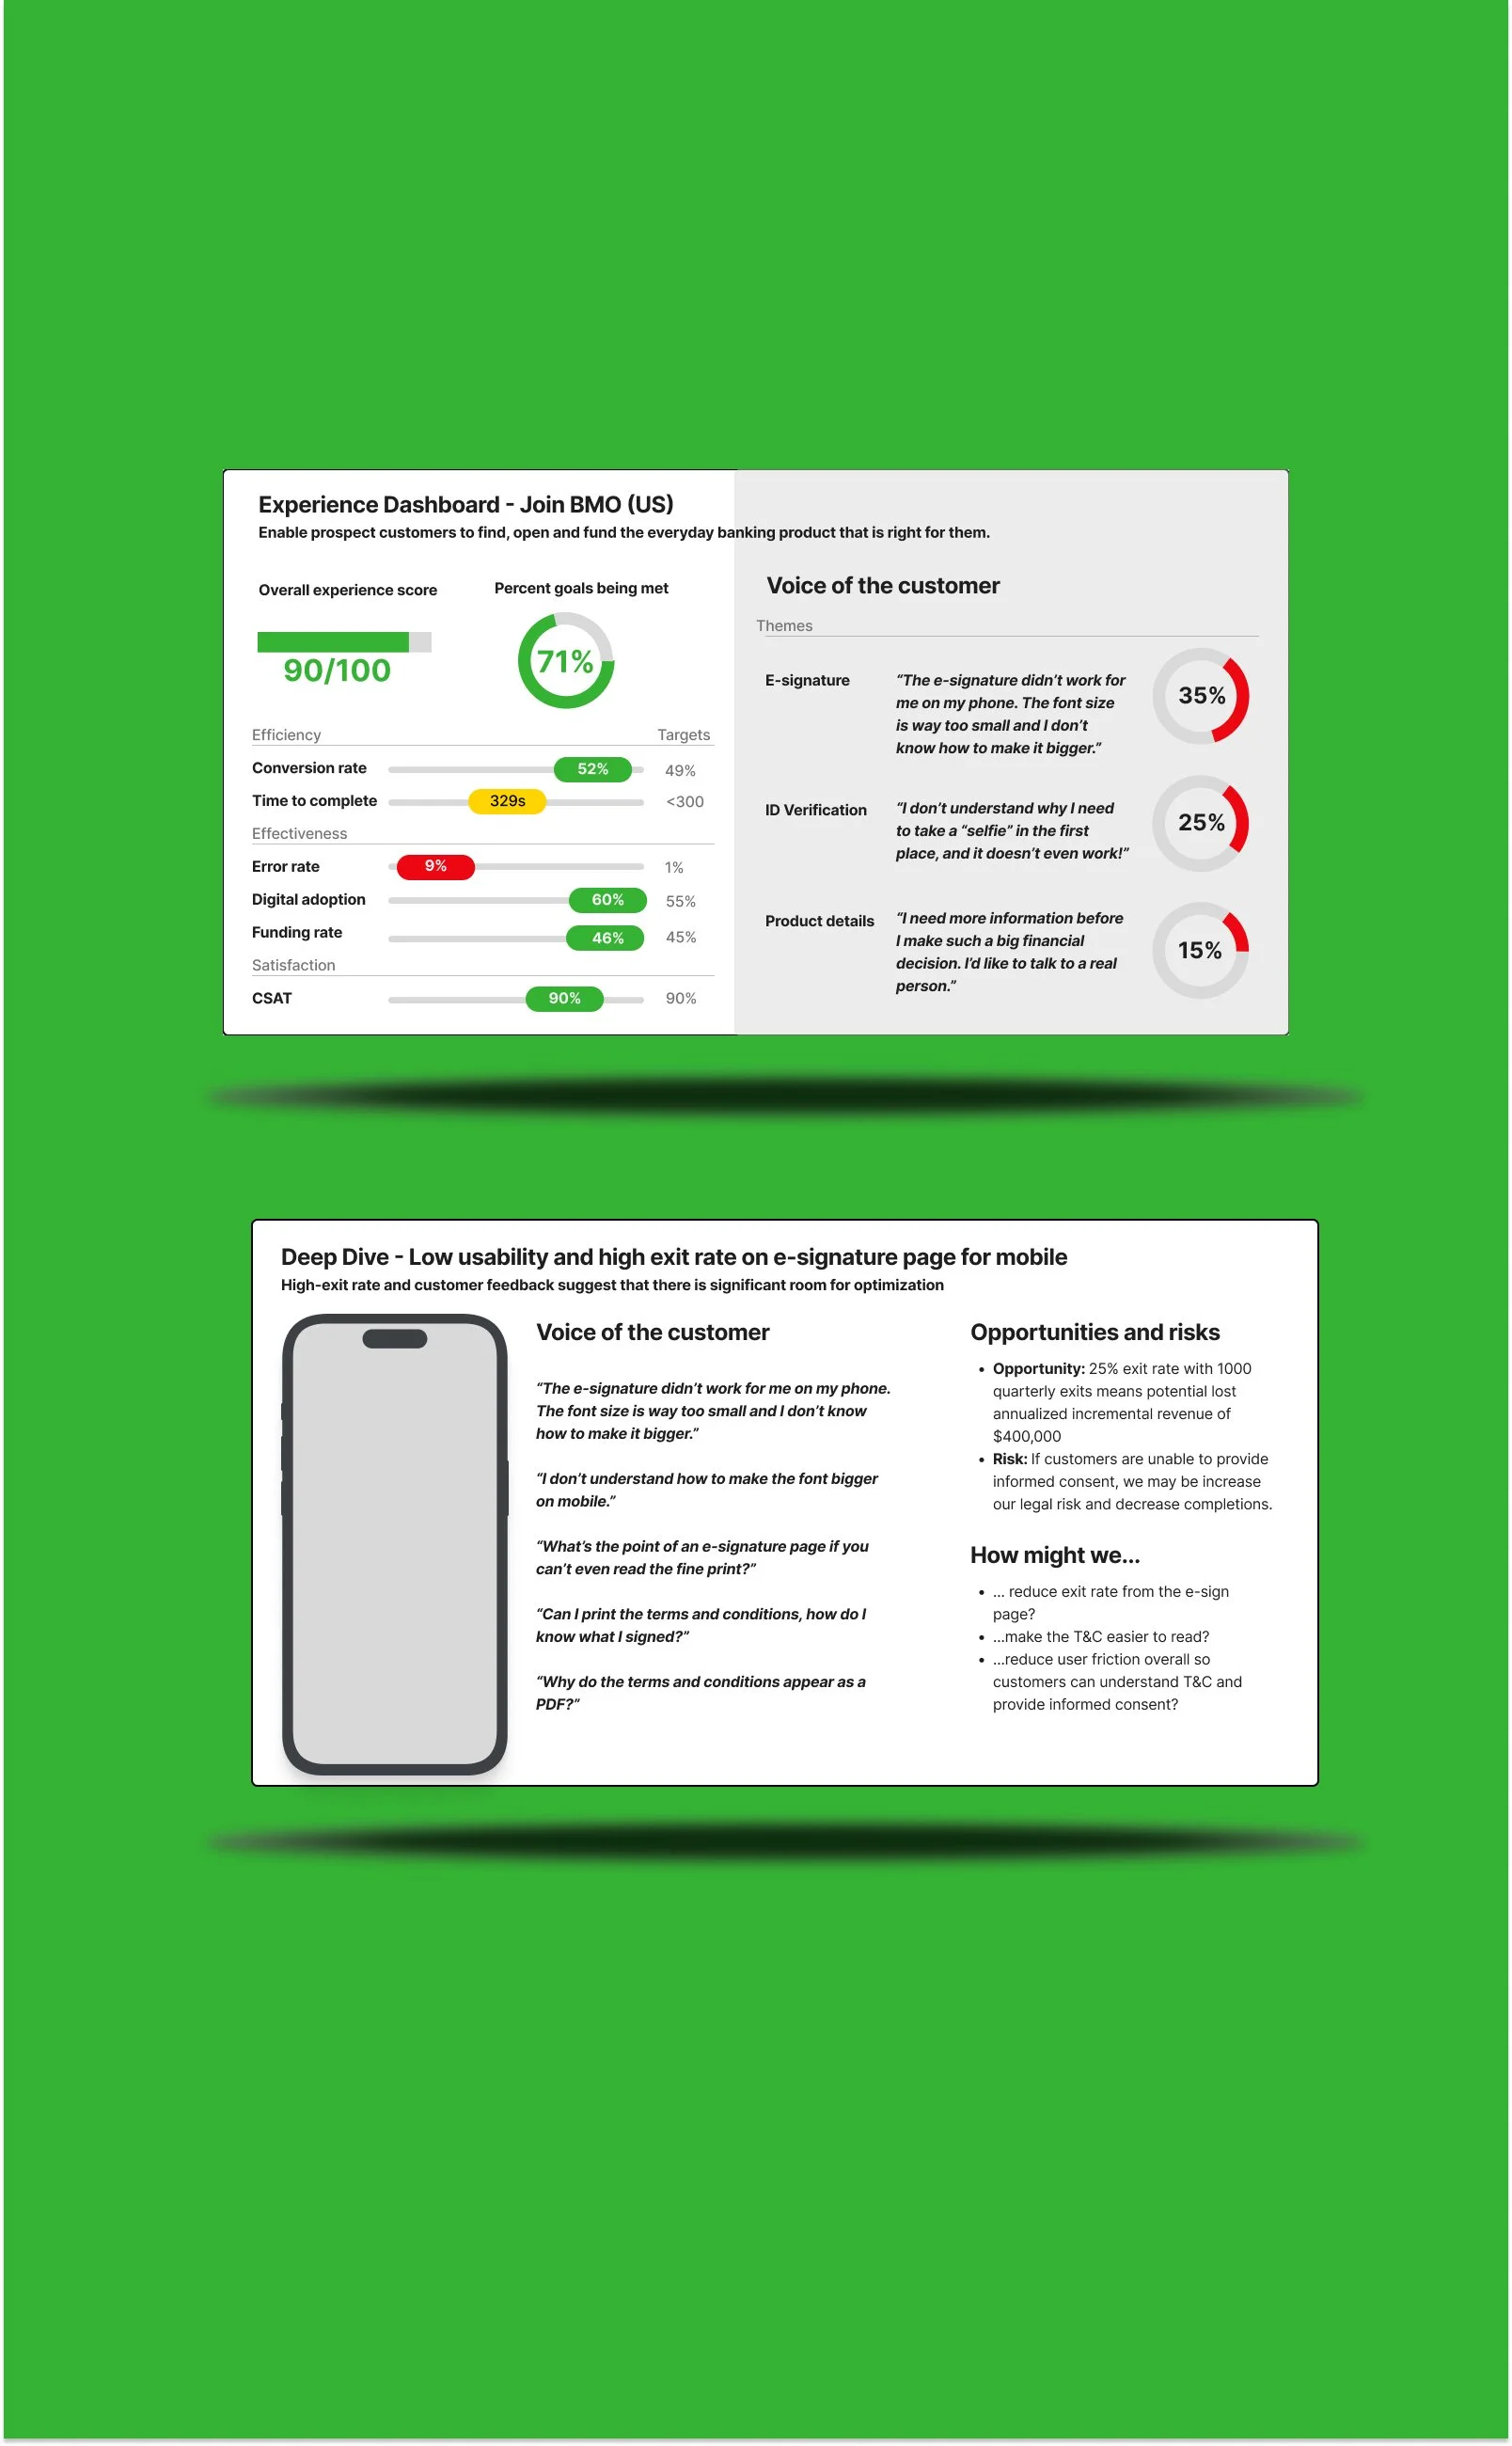
Developed a framework to measure user experience metrics for key journeys across the enterprise. Created dashboards, deep-dives and held cross-functional workshops for 4+ key journeys.
My role
Senior Manager - Experience design
Client
Bank of Montreal
Year
2023
Discover & Define
We interviewed key stakeholders to understand goals and pain points at leadership level (Chief Digital Officer, Head of Design, Heads of Digital Product)
Leveraged internal employee engagement metrics which revealed Designers felt disconnected from the results of the work they were doing
Ideate & Co-create
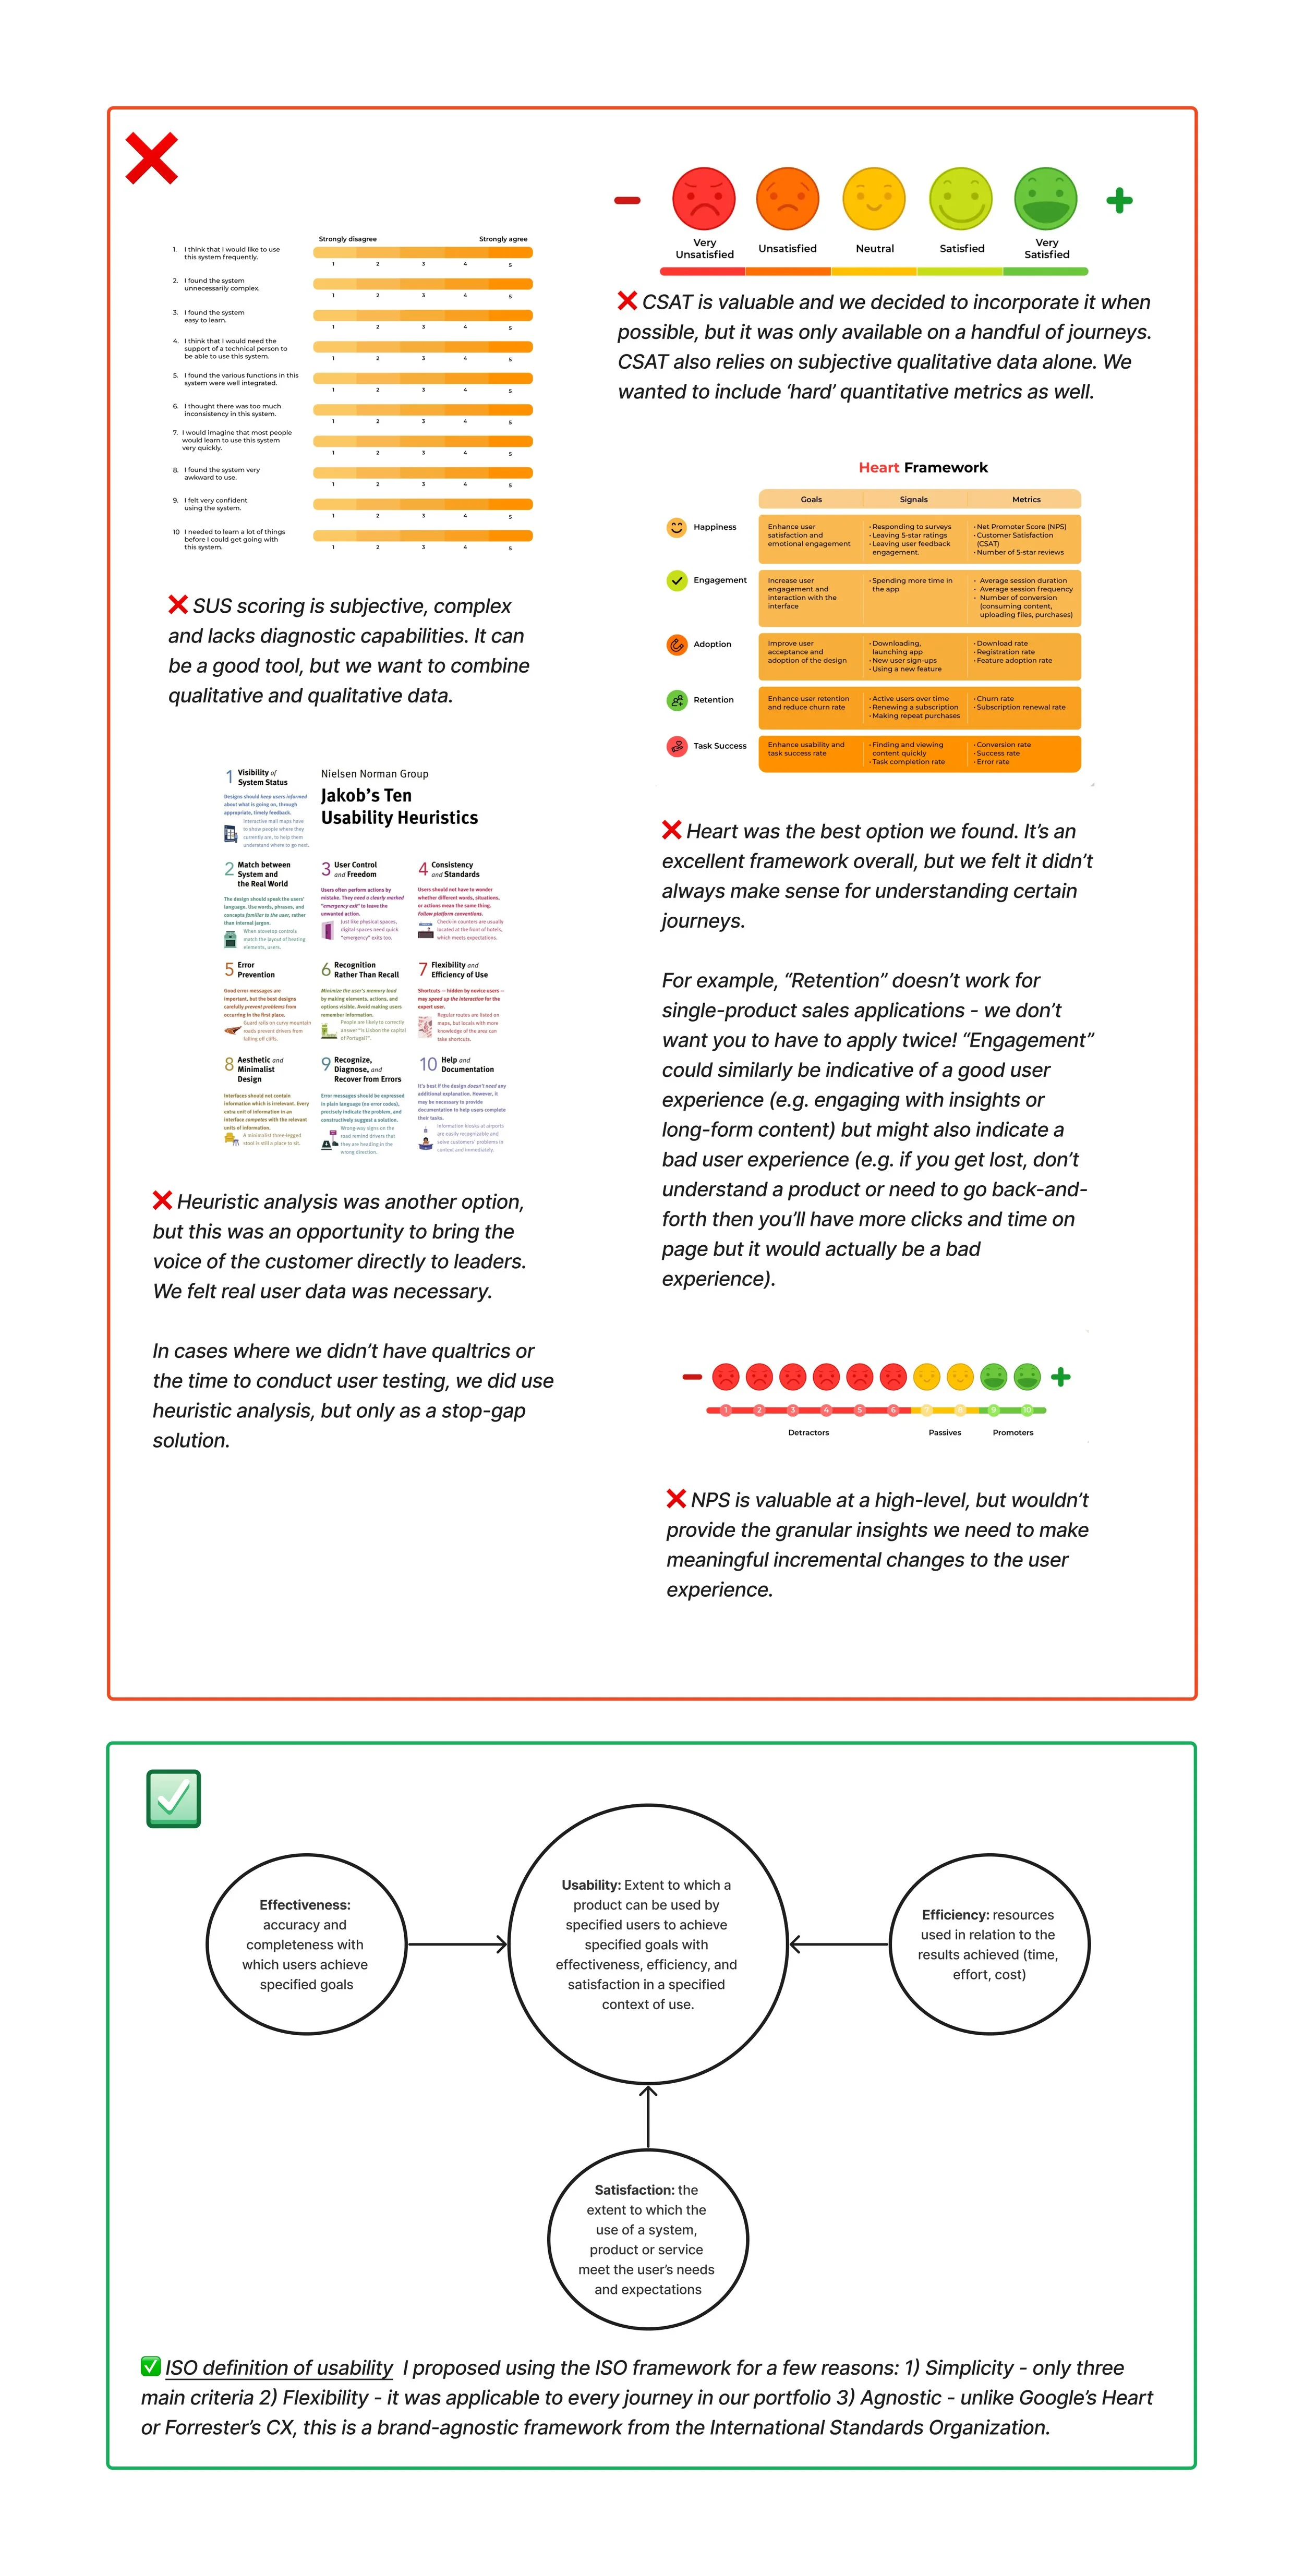
Explored a number of frameworks: SUS (Systems Usability Scale), CSAT (Customer satisfaction score), NPS (Net promoter score), CX Index (Forester).
I proposed we use the ISO definition of usability: Efficiency, Effectiveness and Satisfaction.
We iterated rapidly on the dashboards with feedback from both Senior Leaders and run teams
Leveraged data from Adobe Analytics, Power BI, and other sources
Prototype & Test
Identified key journeys to pilot the first few health checks
Built custom dashboards in Adobe Analytics
Pulled Power BI and Adobe Analytics into excel to analyze data
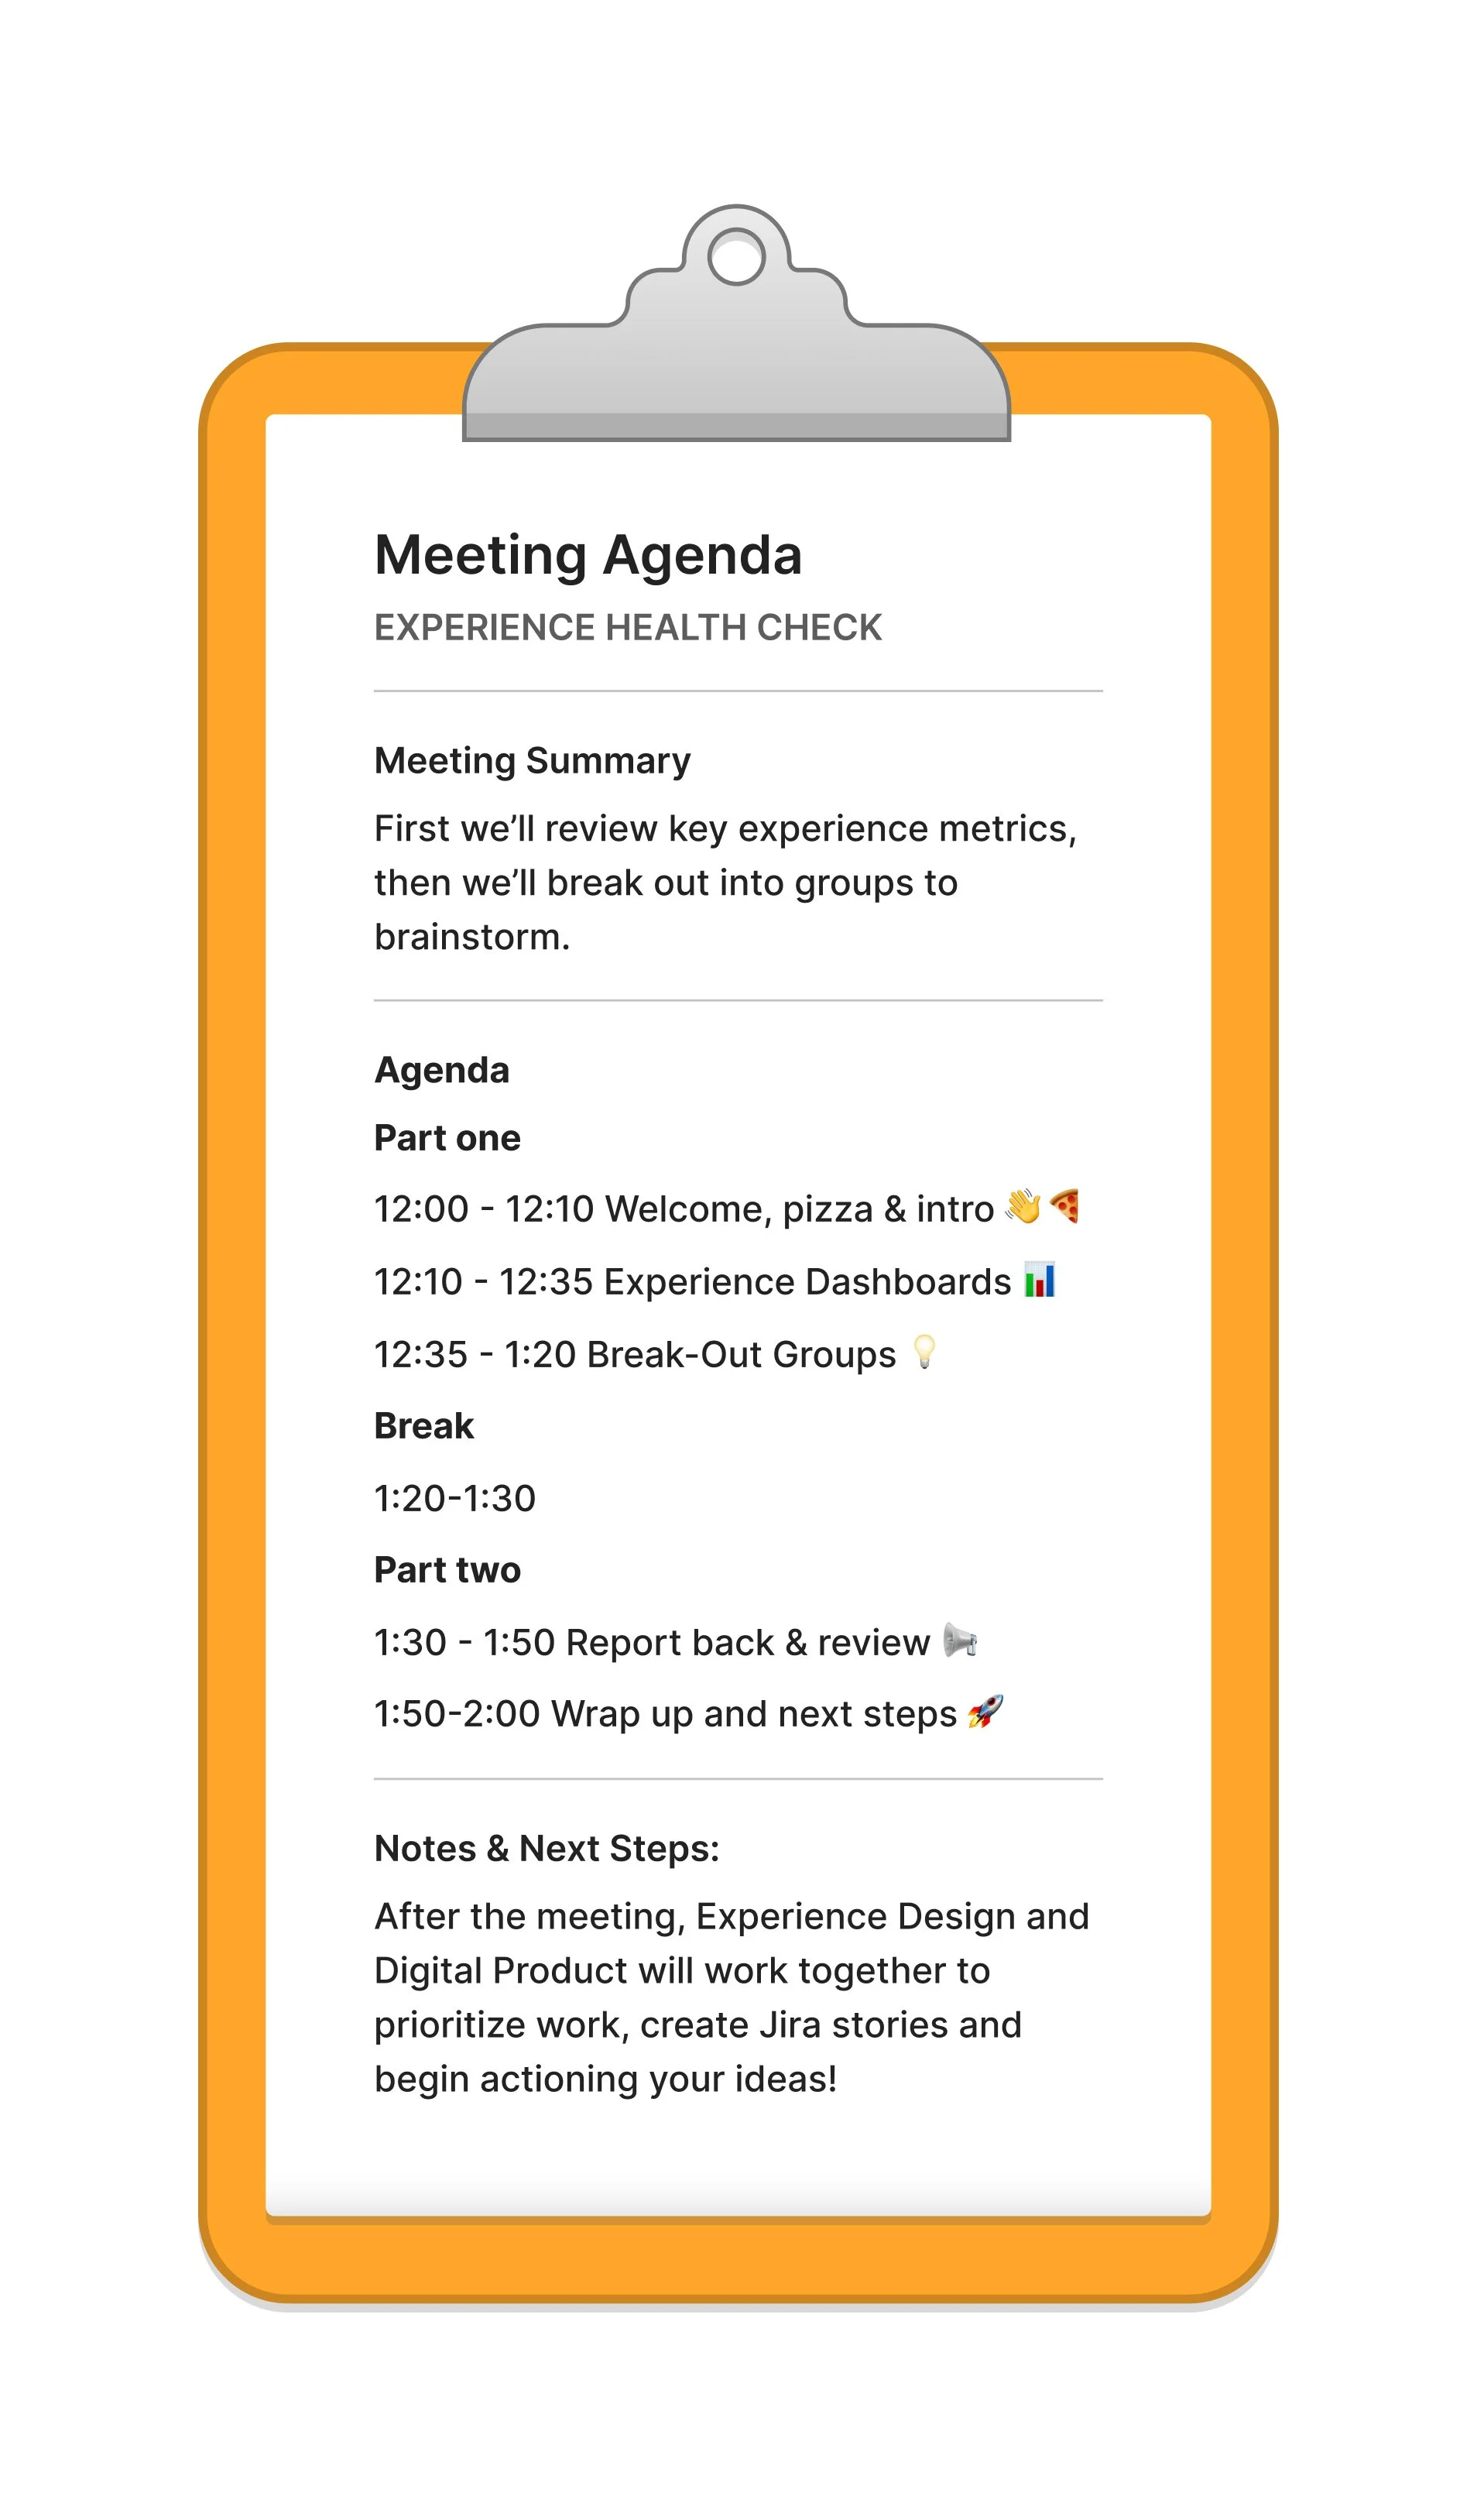
Piloted experience metrics and ‘Health Check Workshops’ with 20+ participants from design, digital product, marketing, tech, legal and banking products.
Presented back to senior leadership
MVP & Release
Once we were confident that we had an ideal version, validated by user testing, we worked closely with dev teams to deliver a requirements document.
We then defined an MVP that met user needs and business requirements while still being feasible from a tech perspective.
Results & Learning
Results:
Product Owners are now accountable for CSAT in addition to business goals
7+ new CSAT surveys planned to be implemented on key journeys for greater qualitative data
~50 point increase in employee engagement for “Shares team performance results openly to encourage the group to improve”
Overall employee engagement score up ~10% for Experience Design
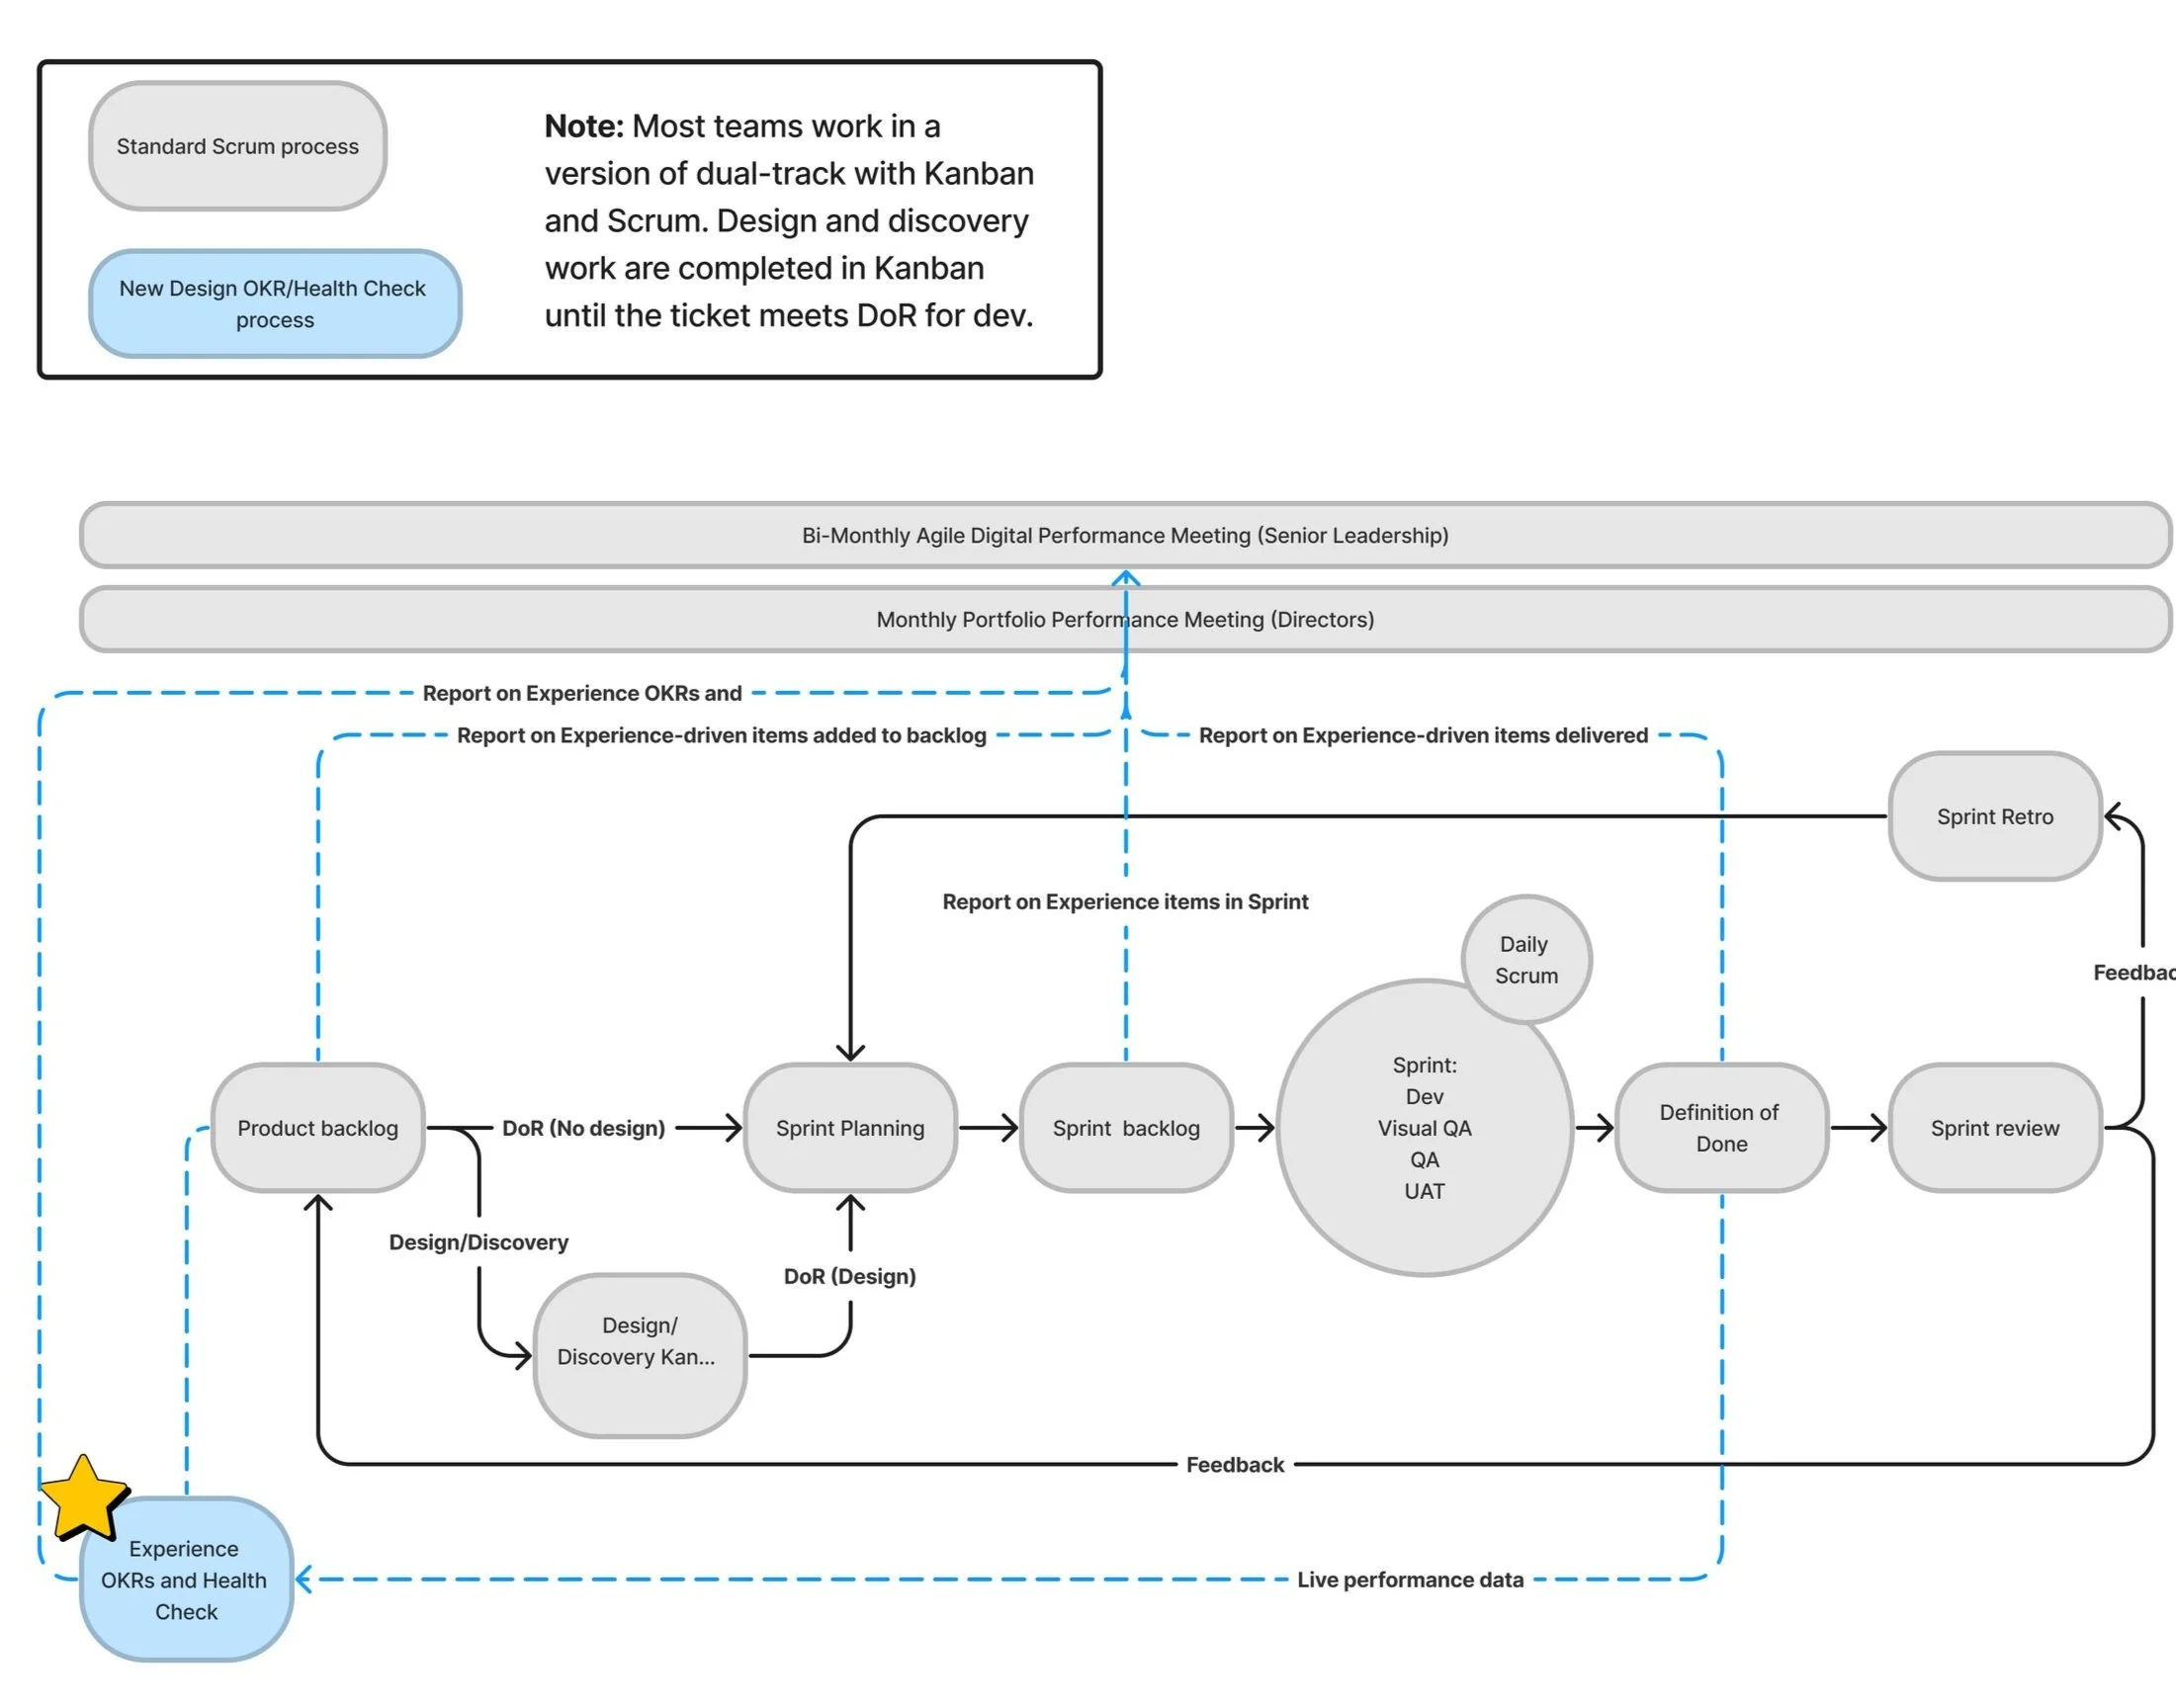
45+ user experience items added to backlogs and roadmaps
Learnings: Although the workshops and metrics were very effective, they were also time-consuming. Going forward we’re going to use a more lightweight version.